Browser distribution
The Browser Distribution chart shows the number of recorded risk evaluations by user browser family.
To access the Browser Distribution chart, go to Monitoring > Threat Protection.
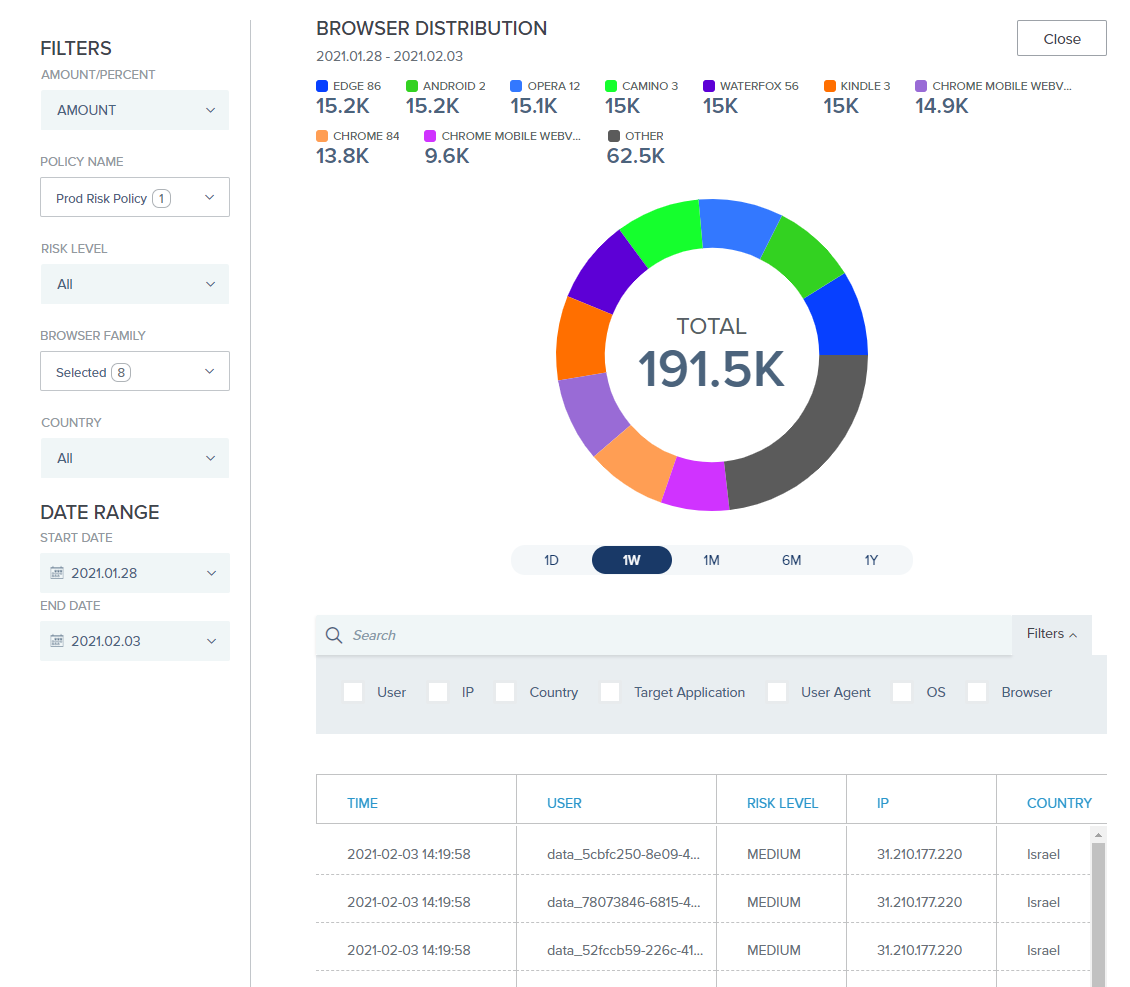
The drill-down table shows more detailed information about each risk evaluation event, such as IP address and target application.
Scroll to the right to see additional columns. Learn more about using the filtered search bar in Filtered searching.
You can click a column header to sort the results by that value. Results are sorted by the Time column by default, with the most recent entries listed first.