Trace incoming and outgoing requests
When a user interacts with Ping Identity Platform, the request can travel through multiple services before it completes. Distributed tracing lets you monitor the request flow through Ping Identity Platform.
Tracing provides a single view of a request’s journey and makes it easier to locate bottlenecks and errors. If issues arise, tracing makes it easier to identify the service causing the problem. It’s more efficient and effective than sifting through isolated logs.
By identifying slow services, tracing helps you optimize application performance and reduce debugging time. This improves the end user experience as users are less likely to encounter errors or slow loading times.
AM supports the OpenTelemetry framework (OTEL) for collecting distributed tracing data.
Which requests are traced?
AM supports distributed tracing for the following request types:
-
Incoming HTTP requests
-
Outgoing HTTP requests to PingIDM (Ping Identity Platform deployments only)
-
Outgoing LDAP requests
These requests are searchable and identifiable for the following LDAP operations:
-
ADD
-
MODIFY
-
SEARCH
-
DELETE
-
BIND
-
-
Outgoing scripting HTTP requests
Understand a trace object
This section provides a brief overview of an OTEL trace object. Learn more about trace objects in Traces.
A trace represents the path of a request through an application. A trace is made up of one or more spans.
Each span includes the following elements:
-
traceIdrepresenting the trace that the span is part of -
spanIda unique ID for that span -
parentSpanIdthe ID of the originating request
The root span indicates the start and end of an entire operation. The parentSpanId of the root span is null because
the root span isn’t part of an existing trace.
Subsequent spans in the trace have their own unique spanId. Their traceId is the same as that of the root span.
Their parentId matches the spanId of the root span.
Example trace object
{
  "spans":[
    {
      "traceId":"8c3ebde938a6cf04f5bb34dd03135d45",
      "spanId":"335776e2b57ee9cf",
      "parentSpanId":"4065c5580cf47c7",
      "name":"HTTP POST /am/json/alpha/authenticate",
      "kind":1,
      "startTimeUnixNano":"1718811677526761641",
      "endTimeUnixNano":"1718811677526761641",
      "attributes":[],
      "events":[],
      "Links":[],
      "status":{
        "code":1
      },
      "flags":257
    }
  ]
}
Learn more in Traces in the OpenTelemetry documentation.
Enable and disable distributed tracing
Distributed tracing is disabled by default.
Enable distributed tracing
-
Stop AM or the container in which it runs.
-
In the
/path/to/am/configdirectory, create adeployment/tracedirectory. For example:-
Linux
-
Windows
$ mkdir -p /path/to/am/config/deployment/tracePS C:\Users\Administrator> New-Item -ItemType Directory 'C:\path\to\am\config\deployment\trace' -
-
In the
deployment/tracedirectory, create a file namedconfig.jsonwith, at least, the following contents:{ "tracing": { "enabled": true } }Find information on additional configuration properties in Configure distributed tracing.
If the content of config.jsonis invalid JSON, distributed tracing remains disabled, even if you set"enabled": true. -
Restart AM or the container in which it runs.
Configure distributed tracing
The Ping Identity Platform supports a common set of configuration properties for OpenTelemetry support.
|
To change the default OpenTelemetry configuration, add the configuration properties to your /path/to/am/config/deployment/trace/config.json file, for example:
{
  "tracing": {
    "enabled": true,
    "resourceAttributes": {
      "service.instance.id": "am-server-1"
    },
    "exporter": {
      "config": {
        "headers": {
          "X-CUSTOM-HEADER": "custom-value"
        }
      }
    },
    "spanLimits": {
      "maxNumberOfAttributesPerEvent": 128
      }
    }
  }
}
Distributed tracing configuration properties
- enabled: boolean, optional
-
Set to
trueto enable OpenTelemetry tracing.Default:
false - resourceAttributes: object, optional
-
A map of additional resource attributes for processing traces. Find more information in the OpenTelemetry documentation on Semantic Attributes with SDK-provided Default Value.
For example, if there are multiple AM instances in a deployment, you could set the
"service.instance.id"resource attribute differently for each one to distinguish between them:{ "resourceAttributes": { "service.instance.id": "am-server-1" } } - exporter: object, optional
-
Configuration for the exporter, which pushes traces to the OpenTelemetry service:
- type: string, optional
-
Set to
otlpfor OpenTelemetry Protocol (OTLP) support. This is currently the only supported protocol.Default:
otlp - config: object, optional
-
Endpoint and timeout configuration:
-
compressionMethod: enumeration, optionalMethod used to compress trace data; either
gzipornone.Default:
gzip -
connectionTimeout: duration, optionalTime out a connection to the endpoint after this duration.
Default: 10 seconds.
-
endpoint: string, optionalThe endpoint to publish traces to.
For HTTPS, AM trusts the default JVM CAs. To override this, set the
-Djavax.net.ssl.trustStoreand associated JVM settings when starting AM. Learn more about the optional settings in the Java Secure Socket Extension (JSSE) Reference Guide.AM doesn’t support TLS configuration for the tracing endpoint at this time.
Default:
http://localhost:4318/v1/traces -
headers: object, optionalMap of additional headers to include in the export span request.
The following example sets the authorization header,
Authorization: Bearer ${bearer.token}:"headers": { "Authorization": "Bearer ${bearer.token}" } -
retries: object, optionalDefines a retry policy for the export span requests.
Default: Enabled
-
backoffMultiplier: number, optional Multiplier for the backoff wait time before retries.Default: 1.5
-
enabled: boolean, optionalRetry failed requests.
Default:
true -
initialBackoff: duration, optionalHow long to wait before the first retry.
Default: 1 second
-
maxAttempts: number, optionalMaximum number of retries.
Default: 5
-
maxBackoff: duration, optionalMaximum wait time between retries.
Default: 5 seconds
-
-
"timeout": duration, optionalTime out a request to publish data to the endpoint after this duration.
Default: 10 seconds.
-
batch: object, optional-
Enable and configure batch processing for trace data.
-
compressionMethod: enumeration, optionalMethod used to compress trace data; either
gzipornone.Default:
gzip -
enabled: boolean, optionalLeave batch processing enabled in deployment.
Default:
true -
exporterTimeout: duration, optionalTime out a data exporter after this duration.
Default: 30 seconds
-
exportUnsampledSpans: boolean, optionalWhether to report on unsampled spans.
Default:
false -
maxExportBatchSize: number, optionalMaximum number of spans in a batch.
Default: 512
-
maxQueueSize: number, optionalMaximum number of spans to queue before dropping them.
Default: 2048
-
scheduleDelay: duration, optionalMaximum interval between sending batches of trace data.
Default: 50 seconds
-
sampler: object, optional-
Configuration for sampling spans.
ratio: number, optional-
For ratio-based types, a percentage of spans to process.
Default: 50 (percent)
type: string, optional-
The sampler strategy to use is one of the following:
-
alwaysOn: Send every span for processing. -
alwaysOff: Never send any span for processing. -
traceIdRatio: Sample the specified ratio of spans, deterministically based on the trace IDs of the spans. -
parentBasedAlwaysOn: Always send the span for processing if the parent span was sampled. (Default) -
parentBasedAlwaysOff: Never send the span for processing if the parent span was sampled. -
parentBasedTraceIdRatio: Send the specified ratio of spans for processing if the parent span was sampled.
-
spanLimits: object, optional-
Configuration for limits enforced when recording spans.
maxNumberOfAttributes: number, optional-
The maximum number of attributes per span.
Default: 128
maxNumberOfAttributesPerEvent: number, optional-
The maximum number of metadata items (attributes) attached to a span per event. An event is an annotation to span at a particular, meaningful point in time during the span’s duration.
Default: 128
maxNumberOfAttributesPerLink: number, optional-
The maximum number of attributes per link.
Default: 128
maxNumberOfEvents: number, optional-
The maximum number of events per span.
Default: 128
maxNumberOfLinks: number, optional-
The maximum number of links per span. Links associate the current span with one or more other spans.
Default: 128
Secure trace exports
To protect trace exports, configure a secure connection between AM and the trace collector.
These steps assume you’re using the OpenTelemetry (OTel) Collector, but you can choose any trace collector. Adjust the steps accordingly.
Configuring a secure connection involves the following steps:
-
Configure the collector to receive traces over HTTPS.
Specify the path to your collector’s TLS certificate and private key and, optionally, the path to the CA certificate.
If you’re using the OTel collector, read OTel’s collector documentation for information on configuring TLS.
-
In the
/path/to/am/config/deployment/trace/config.jsonfile, make sure the exporter endpoint references HTTPS. For example:{ "tracing": { "enabled": true, "exporter": { "config": { "endpoint": "https://otelcol.localtest.me:4318/v1/traces" } } } } -
Add the trace collector’s TLS certificate to the AM truststore. For example:
$ keytool \ -importcert \ -file /path/to/cert_file.pem \ -keystore /path/to/am/security/keystores/truststore -
Restart AM or the container in which it runs.
Visualize traces with Jaeger
You can use Jaeger to collect trace data directly from AM (or from your chosen telemetry collector) and to visualize that trace data.
Example visualization with Jaeger
This example assumes a local AM deployment in Apache Tomcat.
-
Start Jaeger.
Jaeger runs in a Docker container. Start Jaeger with a command similar to the following:
docker run --rm --name jaeger \ -p 5778:5778 \ -p 16686:16686 \ -p 4317:4317 \ -p 4318:4318 \ -p 14250:14250 \ -p 14268:14268 \ -p 9411:9411 \ jaegertracing/jaeger:2.0.0 \ --set receivers.otlp.protocols.http.endpoint=0.0.0.0:4318 -
Go through an AM authentication flow.
This example authenticates the
amAdminuser:* curl \ --request POST \ --header "Content-Type: application/json" \ --header "X-OpenAM-Username: amadmin" \ --header 'X-OpenAM-Password: password' \ --header "Accept-API-Version: resource=2.0, protocol=1.0" \ "https://am.example.com:8443/am/json/realms/root/authenticate"* -
Navigate to Jaeger’s UI at http://localhost:16686/.
-
Under Service select
am(or the context path where you deployed AM) then click Find Traces.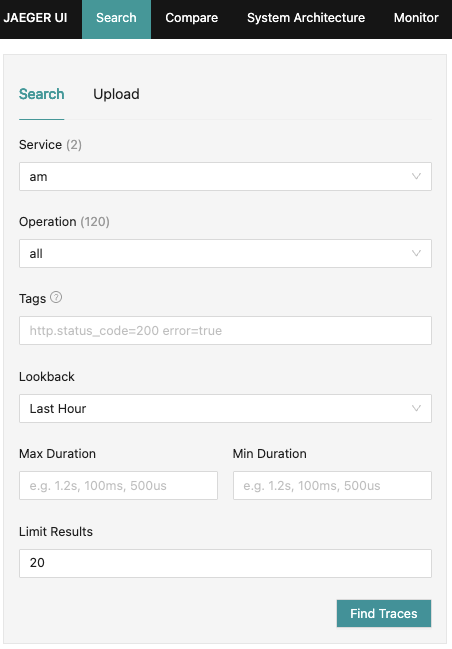
-
Click the trace for the
HTTP POSTrequest to theauthenticateendpoint to view the traces for the authentication flow: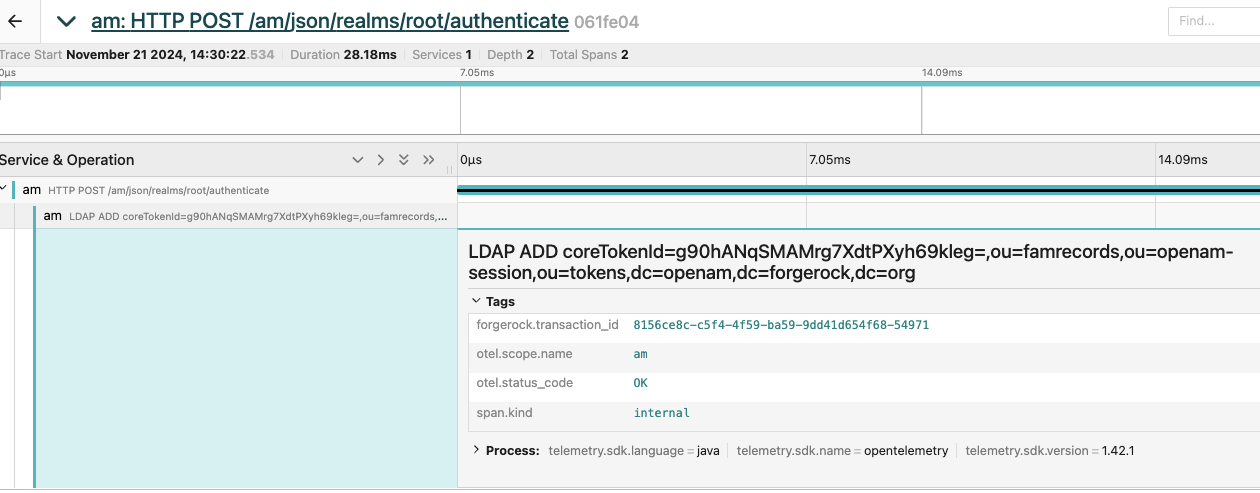
Note the
forgerock.transaction_id 8156ce8c-c5f4-4f59-ba59-9dd41d654f68-54971. This is the ID you’ll use to correlate the trace with the AM audit logs.
Correlate traces with audits
Distributed tracing doesn’t change the AM audit logs in any way.
However, when you enable distributed tracing, you can enrich the traces to include audit transaction IDs in their metadata. If a request includes a transaction identifier and a span is created for that request, the span metadata is enriched with the transaction identifier. This lets you correlate requests between traces and audit logs to determine which requests are taking longer than anticipated and identify any bottlenecks.
In the previous example, the forgerock.transaction_id was 8156ce8c-c5f4-4f59-ba59-9dd41d654f68-54971 for the
authentication request.
The entry in the authentication.audit.json file for that request is as follows:
{
  "_id": "8156ce8c-c5f4-4f59-ba59-9dd41d654f68-54986",
  "timestamp": "2024-11-21T12:30:22.561Z",
  "eventName": "AM-LOGIN-COMPLETED",
  "transactionId": "8156ce8c-c5f4-4f59-ba59-9dd41d654f68-54971",
  "trackingIds": [
    "8156ce8c-c5f4-4f59-ba59-9dd41d654f68-54974"
  ],
  "userId": "id=amadmin,ou=user,dc=am,dc=example,dc=com",
  "principal": [
    "amadmin"
  ],
 ...
}
Note the correlation between the forgerock.transaction_id in the trace and the transactionId in the log entry.