Post-installation tasks
This page covers post-installation tasks relating to authentication nodes, such as testing, debugging, auditing, and performance monitoring.
Test nodes
You can test authentication nodes in multiple ways, including unit tests, functional tests, and performing exploratory or manual testing.
Authentication nodes are well suited to tests that have a high percentage of code coverage. The low number of static dependencies lets you unit test the node class as well as the business logic classes.
Unit tests
Your unit tests should aim to cover a high percentage of the code. Most of the business logic is defined by the tree layout instead of within the nodes themselves, which simplifies unit testing.
At a minimum, the process(TreeContext context) method must be tested to make sure all appropriate code paths are
triggered, based on whether appropriate values in the shared state and callbacks exist.
The TreeContext class and contents have been designed to simplify unit tests without needing to mock.
Functional tests
Functional tests involve creating an authentication tree in an AM instance and testing it using the REST API. You should write them to cover all the possible authentication flows, including successful and unsuccessful outcomes.
Consider the following when writing functional tests:
-
All relevant code paths discovered through unit testing should be functionally tested to ensure helper, utility, and related mechanisms function as expected.
-
Functional tests must make sure the business logic is called correctly and processed as expected.
-
Mocking expected services can be useful when functionally testing nodes that make calls to third-party services.
To perform functional testing, write a series of REST requests to create the authentication tree and test all the identified flows through the authentication tree. The REST API returns a JSON payload, which lets you programmatically step through each node and collect responses at every stage.
You can find details about creating a tree using the REST API in Create an authentication tree over REST.
|
Test your tree in the UI first and use the Developer Tools in your browser to copy relevant web requests as a curl command. The resulting curl command includes all the headers, options, and data sent for the selected web request. You can use this information and the REST syntax as the basis of your REST calls. |
You can use a third-party tool such as Postman for REST-based testing.
Manual testing
Manual testing should occur both during and after node development.
During development, it is expected a node developer will frequently load and reload nodes to ensure they operate as expected, including configuration and execution, as well as any expected error conditions.
After development, manual testing should continue in an exploratory fashion. Using a node multiple times can often highlight areas left unpolished, or particular usability issues that can be missed by automated testing.
Debug nodes
You might need to debug your nodes during development as well as prepare your nodes to allow debug logging after they are deployed.
Use the Debug node
During development, it can be useful to include one or more Debug nodes in your authentication tree to inspect the tree state.
-
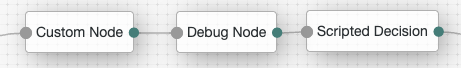
Insert the Debug node in the tree between the node you want to inspect and the next node in the flow. For example, if you wanted to inspect the Custom Node, where the next node was a Scripted Decision node, you would insert the Debug node as follows:
-
Save your changes.
-
Test your tree in a new incognito browser window (or a separate browser).
When the Debug node is reached, a pop-up window displays details about the tree state.
If the browser blocks the pop-up window, unblock it:
-
For Chrome, follow the instructions under the "Allow pop-ups and redirects from a site" section in this support article: https://support.google.com/chrome/answer/95472.
-
For other supported browsers, consult the browser documentation.
Refresh the browser window. The pop-up window should now appear.
-
-
Remove the Debug node once you finish debugging.
Attach a debugger to Apache Tomcat
During development, you may want to attach a remote debugger to Tomcat to let you debug the node development with an IDE (for example, to set breakpoints).
-
Set a
CATALINA_OPTSenvironment variable to enable the debugger on Tomcat. For example, add the following in yoursetenvfile:-
Linux
-
Windows
In
$CATALINA_BASE/bin/setenv.sh:export CATALINA_OPTS="$CATALINA_OPTS -Xdebug -Xrunjdwp:transport=dt_socket, address=*:8000,server=y,suspend=n"In
$CATALINA_BASE/bin/setenv.bat:set "CATALINA_OPTS=%CATALINA_OPTS% -Xdebug -Xrunjdwp:transport=dt_socket, address=*:8000,server=y,suspend=n"The
*:in theaddressoption lets you debug remote servers as well as developments running onlocalhost. -
-
Start the web container as normal.
-
Connect your IDE to Tomcat as a remote JVM debug instance. The way you do this depends on your IDE, but make sure the following settings are correct:
-
Port: the port in the IDE debug configuration must match the port set in thesetenvfile (8000in this example). -
Address: the address should either be the IP address of the Tomcat instance if it’s running on a different machine orlocalhost.
-
-
Remove the debugger options from your
setenvfile once you finish debugging.
Add debug logging
Add debug logging to your custom node to help administrators and support staff investigate any issues that arise in production.
To add debug logging to a node, include a reference to the amAuth SLF4J Logger instance.
For example, you can assign the logger to a private field as follows:
import org.slf4j.Logger;
import org.slf4j.LoggerFactory;

// ...

private final Logger logger = LoggerFactory.getLogger("amAuth");|
Consider the logging level you use. Excessive use of the |
You can also use the SLF4J varargs methods to defer string concatenation to SLF4J.
This means you can skip string concatenation
if the configured logging level means your message won’t be written.
The following example uses the debug level:
logger.debug("authLevelSufficient {}", authLevelSufficient);Audit logging
Audit logging helps administrators to investigate user and system behavior.
AM records all incoming calls as access events. Additionally, to capture further details about the authentication flows, AM records an authentication audit event for each node, and the tree outcome.
A node can provide extra data to be included in the standard audit event which is logged when an authentication node completes.
AM logs an AM-NODE-LOGIN-COMPLETED audit event each time an authentication node completes.
To add extra information to this audit event, override the node interface method getAuditEntryDetail.
For example, the Retry Limit Decision node overrides this method to record how many retries remain:
@Override
public JsonValue getAuditEntryDetail() {
  return json(object(field("remainingRetries", String.valueOf(retryLimitCount))));
}
When this node is processed, it results in an audit event similar to the following:
{
  "realm": "/",
  "transactionId": "45453155-cf94-4e23-8ee9-ecdfc9f97e12-1785617",
  "component": "Authentication",
  "eventName": "AM-NODE-LOGIN-COMPLETED",
  "entries": [
    {
      "info": {
        "nodeOutcome": "Retry",
        "treeName": "Example",
        "displayName": "Retry Limit Decision",
        "nodeType": "RetryLimitDecisionNode",
        "nodeId": "bf010b6b-61f8-457e-80f3-c3678e5606d2",
        "authLevel": "0",
        "nodeExtraLogging": {
          "remainingRetries": "2"
        }
      }
    }
  ],
  "timestamp": "2018-08-24T09:43:55.959Z",
  "trackingIds": [
    "45453155-cf94-4e23-8ee9-ecdfc9f97e12-1785618"
  ],
  "_id": "45453155-cf94-4e23-8ee9-ecdfc9f97e12-1785622"
}
The result of the getAuditEntryDetail method is stored in the nodeExtraLogging field.
Monitor nodes
You can track authentication flows that complete with success, failure, or timeout as an outcome by using the metrics functionality built-in to AM.
Learn more in Monitor AM instances.
You can also use the following nodes in a tree to create custom metrics: